
Elf Stack
Act III
The Front Yard (Alabaster's Side)
Difficulty:
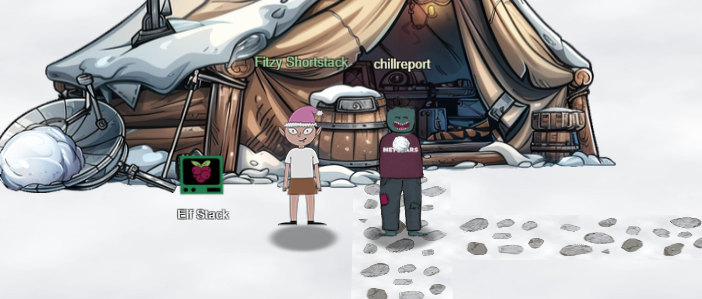
Elf Stack is located in the North West corner of The Front Yard in Act III. Fitzy Shortstack is very proud of the Elf Stack SIEM that was created. Apparently Wombley's team has unleached a cyber attack on the Alabaster side, encrypting the Naughty-Nice list with the Frostbit Ransomware. Even worse, Wombley has lost the decryption keys. We need to trace the attack and find out as much as we can so we can later undo what has been done.
We have two options for completing the objective. Use the Elastic Stack SIEM docker container provided for us or to rely on command line tools to parse the logs and figure out what happened.
I will used a combination of both to complete the objective. The format of this is similar to the KC7 challenge. A bunch of log data is presented to us combined with a web application posing questions about the cyber attack. If we answer the question correctly, it moves us on to the next one. I will try to show what queries I used to find the answers as well as explain the rationale behind it.
The first step is to setup the docker container and get the Elf Stack SIEM up and running. The terminal provides some help data for this.
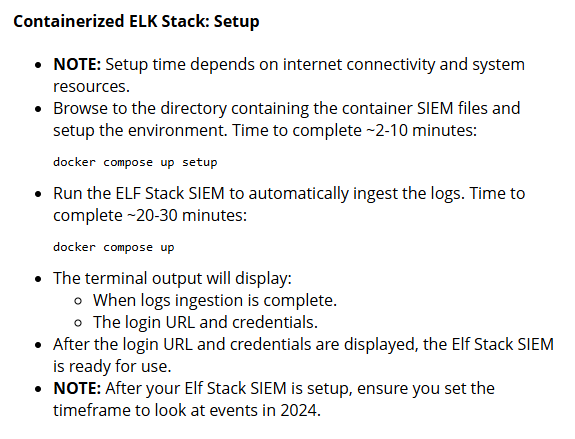
I already have a docker environment, so I just had to download the files and run the docker commands to setup and run the container. I downloaded and extracted the files and ran "docker compose up setup" followed by "docker compose up".
The container takes a few minutes to injest all of the log data, so go get a cup of coffee while it loads.
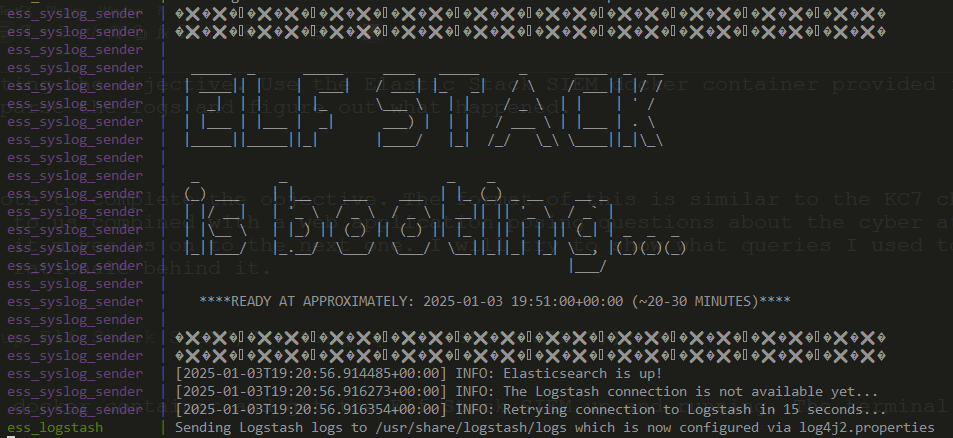
When the image is ready it will display the URL and user credentials on the terminal. Open the URL and login.
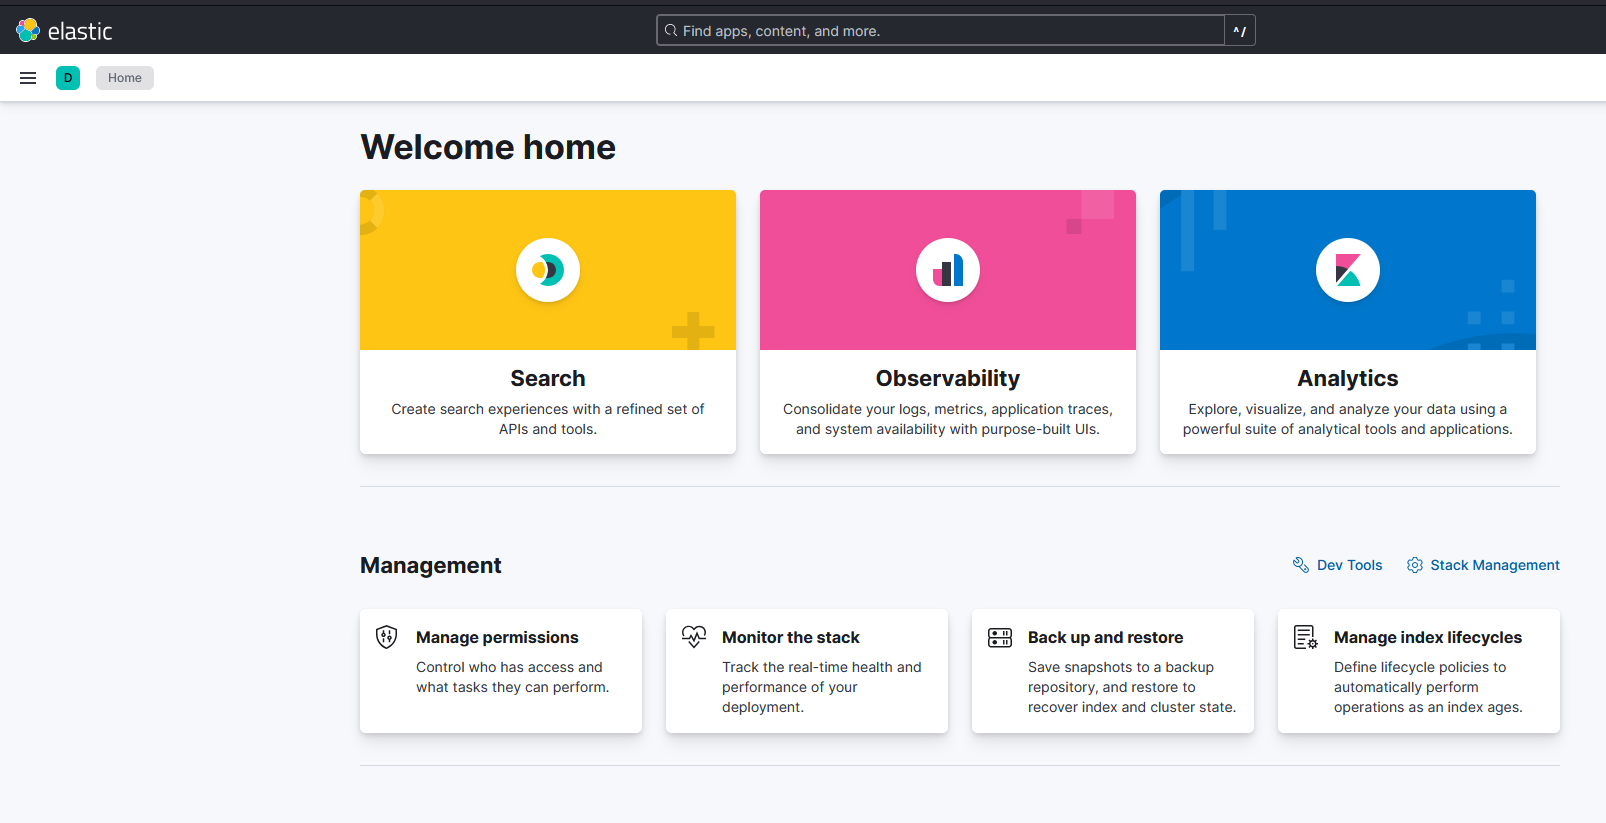
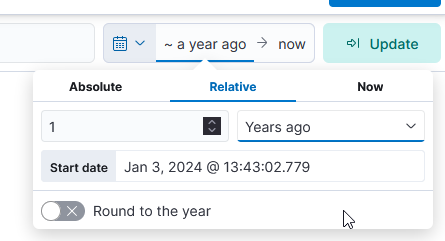
The first thing I did to make sure my queries were running on the correct timeframe. To do this I clicked the menu -> Discover. On the right side there is a calendar icon for the date range. I set the date range to be 1 year and saved it. Now my queries should return data.
Back in the Elf Stack Terminal, I clicked Easy Mode to get started on the silver trophy. Result objects I post may be truncated for brevity.
Question 1: How many unique values are there for the event_source field in all logs?
I found that doing data aggregation is better in the Elastic dev console. To use it click the menu and down at the bottom select Dev Console. I used the following query.
GET _search
{
"aggs":{
        "unique_names": {
            "terms": {
                "field": "event_source"
            }
        }
    },
     "_source": false
}
GET _search
"buckets": [
	{
	  "key": "WindowsEvent",
	  "doc_count": 2299324
	},
	{
	  "key": "NetflowPmacct",
	  "doc_count": 34679
	},
	{
	  "key": "GreenCoat",
	  "doc_count": 7476
	},
	{
	  "key": "SnowGlowMailPxy",
	  "doc_count": 1398
	},
	{
	  "key": "AuthLog",
	  "doc_count": 269
	}
]
5 unique event_source values exist. Enter 5 to continue
Question 2: Which event_source has the fewest number of events related to it?
From the above query, the AuthLog event_source has the fewest events with with 269. Enter AuthLog in the terminal to move to the next question.
Question 3: Using the event_source from the previous question as a filter, what is the field name that contains the name of the system the log event originated from?
I used the Kibana Discover tab to query for this.
event_source : "AuthLog" "event.hostname": [
"kringleSSleigH"
]The field name is "event.hostname". Enter that in the terminal to continue.
Question 4: Which event_source has the second highest number of events related to it?
Look at the query result from Question 1. The "NetflowPmacct" event_source has events 34679, which is the 2nd highest. Enter NetflowPmacct in the terminal to move on to the next question.
Question 5: Using the event_source from the previous question as a filter, what is the name of the field that defines the destination port of the Netflow logs?
event_source : "NetflowPmacct""event.port_dst": [
443
]The field "event.port_dst" is the one for the destination port. Enter this in the terminal to continue.
Question 6: Which event_source is related to email traffic?
Using the event_source names from Question 1, I inferred that "SnowGlowMailPxy" is the one related to email traffic. Enter this in the terminal to continue.
Question 7: Looking at the event source from the last question, what is the name of the field that contains the actual email text?
event_source : "SnowGlowMailPxy""event.Body": [
"Dear elf_user03,\n\nI hope this email finds you in good spirits. I wanted to inform you that it is time for the performance reviews for this quarter. Please make sure all the necessary documents and evaluations are completed and submitted by the deadline, which is next Friday. \n\nBest regards,\nelf_user05\n"
]"event.Body" is the field that contains the email text. Enter this into the terminal to continue.
Question 8: Using the 'GreenCoat' event_source, what is the only value in the hostname field?
I used the Elastic Search Dev Console for this one.
GET _search
{
  "query": {
    "bool": {
      "must": [
        {"match": {"event_source": "GreenCoat"}}
      ]
    }
  },
  "aggs":{
        "unique_names": {
            "terms": {
                "field": "hostname"
            }
        }
    },
     "_source": false
}"aggregations": {
"unique_names": {
"doc_count_error_upper_bound": 0,
"sum_other_doc_count": 0,
"buckets": [
{
"key": "SecureElfGwy",
"doc_count": 7476
}
]
}
}The only result on the hostname was "SecureElfGwy". Enter this into the terminal to continue.
Question 9: Using the 'GreenCoat' event_source, what is the name of the field that contains the site visited by a client in the network?
I did a basic search and looked at the first result.
event_source : "GreenCoat""event.url": [
"x.bidswitch.net:443"
]The field "event.url" is the name of the field that contains the site name. Enter this into the terminal to continue.
Question 10: Using the 'GreenCoat' event_source, which unique URL and port (URL:port) did clients in the TinselStream network visit most?
I used the Elastic Dev Tools Console to solve this one.
GET _search
{
  "query": {
    "bool": {
      "must": [
        {"match": {"event_source": "GreenCoat"}}
      ]
    }
  },
  "aggs":{
        "unique_names": {
            "terms": {
                "size": 1,
                "field": "event.url"
            }
        }
    },
    "_source": false
}"aggregations": {
"unique_names": {
"doc_count_error_upper_bound": 57,
"sum_other_doc_count": 7326,
"buckets": [
{
"key": "pagead2.googlesyndication.com:443",
"doc_count": 150
}
]
}
}"pagead2.googlesyndication.com:443" was visited the most. Enter this in the terminal to continue.
Question 11: Using the 'WindowsEvent' event_source, how many unique Channels is the SIEM receiving Windows event logs from?
I used the Elastic Dev Tools Console to solve this one.
GET _search
{
  "query": {
    "bool": {
      "must": [
        {"match": {"event_source": "WindowsEvent"}}
      ]
    }
  },
  "aggs":{
        "unique_names": {
            "terms": {
                "field": "event.Channel"
            }
        }
    },
     "_source": false
}"aggregations": {
"unique_names": {
"doc_count_error_upper_bound": 0,
"sum_other_doc_count": 0,
"buckets": [
{
"key": "Security",
"doc_count": 2268402
},
{
"key": "Microsoft-Windows-Sysmon/Operational",
"doc_count": 17713
},
{
"key": "Microsoft-Windows-PowerShell/Operational",
"doc_count": 11751
},
{
"key": "System",
"doc_count": 191
},
{
"key": "Windows PowerShell",
"doc_count": 50
}
]
}
}There are 5 channels returned by the query. Enter 5 in the terminal to continue.
Question 12: What is the name of the event.Channel (or Channel) with the second highest number of events?
From the query in qestion 11, the one with the second highest number of events is "Microsoft-Windows-Sysmon/Operational" with 17713 events. Enter "Microsoft-Windows-Sysmon/Operational" in the terminal to move on.
Question 13: Our environment is using Sysmon to track many different events on Windows systems. What is the Sysmon Event ID related to loading of a driver?
I used an online resource to look up the answer. Sysmon v15.15 Documentation The event ID for loading a driver is Event ID 6. Enter 6 in the terminal to continue.
Question 14: What is the Windows event ID that is recorded when a new service is installed on a system?
I used an online resource to look up the answer. Windows Security Log Events The event ID for when a new service is installed on a system is Event ID 4697. Enter 4697 in the terminal to continue.
Question 15: Using the WindowsEvent event_source as your initial filter, how many user accounts were created?
The Event ID for user account creation is Event ID 4720.
event_source : "WindowsEvent" and event.EventID : 4720The above query returned zero events. Enter "0" in the terminal to gain the silver trophy!
I went back to the terminal main window and select Hard Mode to get started on the Gold trophy
Question 1: What is the event.EventID number for Sysmon event logs relating to process creation?
The Sysmon Event ID for process creation is Event ID 1. Enter 1 in the terminal to continue.
Question 2: How many unique values are there for the 'event_source' field in all of the logs?
From Easy Mode Question 1, the answer is 5. Submit 5 to continue.
Question 3: What is the event_source name that contains the email logs?
From Easy Mode question 6, the answer is SnowGlowMailPxy. Submit this to continue.
Question 4: The North Pole network was compromised recently through a sophisticated phishing attack sent to one of our elves. The attacker found a way to bypass the middleware that prevented phishing emails from getting to North Pole elves. As a result, one of the Received IPs will likely be different from what most email logs contain. Find the email log in question and submit the value in the event 'From:' field for this email log event.
I used the Elastic Dev Tools Console to complete this.
GET _search
{
  "query": {
    "bool": {
      "must": [
        {"match": {"event_source": "SnowGlowMailPxy"}}
      ]
    }
  },
  "aggs":{
        "unique_names": {
            "terms": {
                "field": "event.ReceivedIP2"
            }
        }
    },
     "_source": false
}"aggregations": {
"unique_names": {
"doc_count_error_upper_bound": 0,
"sum_other_doc_count": 0,
"buckets": [
{
"key": "172.24.25.20",
"doc_count": 1397
},
{
"key": "34.30.110.62",
"doc_count": 1
}
]
}
}There is an anomaly here: "34.30.110.62". Use this IP to locate the required email event.
event_source : "SnowGlowMailPxy" and event.ReceivedIP2 : "34.30.110.62" "event.From": [
"kriskring1e@northpole.local"
]The email.From field is "kriskring1e@northpole.local". Submit this to continue.
Question 5: Our ElfSOC analysts need your help identifying the hostname of the domain computer that established a connection to the attacker after receiving the phishing email from the previous question. You can take a look at our GreenCoat proxy logs as an event source. Since it is a domain computer, we only need the hostname, not the fully qualified domain name (FQDN) of the system.
event_source : "GreenCoat" and event.url : "http://hollyhaven.snowflake/howtosavexmas.zip""event.host": [
"SleighRider"
]"SleighRider" is the hostname of the domain computer. Enter this to continue.
Question 6: What was the IP address of the system you found in the previous question?
Using the previous query, look for the "event.ip".
"event.ip": [
  "172.24.25.12"
]
Enter "172.24.25.12" in the terminal to continue.
Question 7: A process was launched when the user executed the program AFTER they downloaded it. What was that Process ID number (digits only please)?
From the previous query in question 5, I know the file was downloaded at timestamp "2024-09-15T14:36:26.000Z". Using this I can search using the Elastic Dev Tools Console to find the process.
GET _search
{
  "query": {
    "bool": {
      "must": [
        {"match": {"event_source": "WindowsEvent"}},
        {"match": {"hostname": "SleighRider.northpole.local"}},
        {"match": {"event.EventID": 1}}
      ],
      "filter": [
        { "range": { "@timestamp": { "gt": "2024-09-15T14:36:26.000Z" }}}
      ]
    }
  }
}
There were 14 results from this query. I narrowed it down based on the Image being a similar file name as the phishing email: "howtosavexmas.pdf.exe"
"event": {
	"Task": 1,
	"ParentImage": """C:\Windows\explorer.exe""",
	"Company": "-",
	"LogonGuid": "{face0b26-426d-660c-650f-7d0500000000}",
	"Keywords": "-9223372036854775808",
	"User": """NORTHPOLE\elf_user02""",
	"Description": "-",
	"Category": "Process Create (rule: ProcessCreate)",
	"OriginalFileName": "-",
	"IntegrityLevel": "High",
	"EventType": "INFO",
	"TerminalSessionId": 1,
	"ParentProcessId": 5680,
	"Product": "-",
	"ParentUser": """NORTHPOLE\elf_user02""",
	"Image": """C:\Users\elf_user02\Downloads\howtosavexmas\howtosavexmas.pdf.exe""",
	"ProcessGuid": "{face0b26-426e-660c-eb0f-000000000700}",
	"MoreDetails": "Process Create:",
	"CurrentDirectory": """C:\Users\elf_user02\Downloads\howtosavexmas\""",
	"SeverityValue": 2,
	"Version": 5,
	"UserID": "S-1-5-18",
	"FileVersion": "-",
	"ProcessID": 10014,
	"ParentCommandLine": """C:\Windows\Explorer.EXE""",
	"LogonId": "0x57d0f65",
	"RuleName": "-",
	"OpcodeValue": 0,
	"SourceModuleType": "im_msvistalog",
	"Channel": "Microsoft-Windows-Sysmon/Operational",
	"Hostname": "SleighRider.northpole.local",
	"SourceName": "Microsoft-Windows-Sysmon",
	"Severity": "INFO",
	"AccountType": "User",
	"SourceModuleName": "inSysmon",
	"ProviderGuid": "{5770385F-C22A-43E0-BF4C-06F5698FFBD9}",
	"CommandLine": "\"C:\\Users\\elf_user02\\Downloads\\howtosavexmas\\howtosavexmas.pdf.exe\" ",
	"OpcodeDisplayNameText": "Info",
	"ThreadID": 6340,
	"Hashes": "MD5=790F0E0E9DBF7E9771FF9F0F7DE9804C,SHA256=7965DB6687032CB6A3D875DF6A013FA61B9804F98618CE83688FBA546D5EC892,IMPHASH=B4C6FFF030479AA3B12625BE67BF4914",
	"EventTime": "2024-09-15T14:37:50.000Z",
	"EventID": 1,
	"ProcessId": 8096,
	"Domain": "NT AUTHORITY",
	"ParentProcessGuid": "{face0b26-e149-6606-9300-000000000700}",
	"RecordNumber": 723,
	"AccountName": "SYSTEM"
}
The Process ID for this event was 10014. Submit 10014 to continue.
Question 8: Did the attacker's payload make an outbound network connection? Our ElfSOC analysts need your help identifying the destination TCP port of this connection.
I looked for EventID 3 (Network Connection detected) and added on the process ID to my previous query.
GET _search
{
  "query": {
    "bool": {
      "must": [
        {"match": {"event_source": "WindowsEvent"}},
        {"match": {"hostname": "SleighRider.northpole.local"}},
        {"match": {"event.EventID": 3}},
        {"match": {"event.ProcessID": 10014}}
      ],
      "filter": [
        { "range": { "@timestamp": { "gt": "2024-09-15T14:36:26.000Z" }}}
      ]
    }
  },
  "_source": [
      "@timestamp",
      "event.DestinationIp",
      "event.DestinationPort",
      "event.Image"
  ],
  "sort": [
    {
      "@timestamp": {
        "order": "asc"
      }
    }
  ]
}"event": {
"Image": """C:\Users\elf_user02\Downloads\howtosavexmas\howtosavexmas.pdf.exe""",
"DestinationPort": 8443,
"DestinationIp": "103.12.187.43"
}The destination port is "8443". Submit this to continue.
Question 9: The attacker escalated their privileges to the SYSTEM account by creating an inter-process communication (IPC) channel. Submit the alpha-numeric name for the IPC channel used by the attacker.
I looked for process creation events (EventID 1) on that host that occured after the "howtosavexmas.pdf.exe" file was launched. I set a filter for "@timestamp >= 2024-09-15T14:37:50.000Z" and looked for the nearest events.
event_source : "WindowsEvent" and hostname : "SleighRider.northpole.local" and event.EventID: 1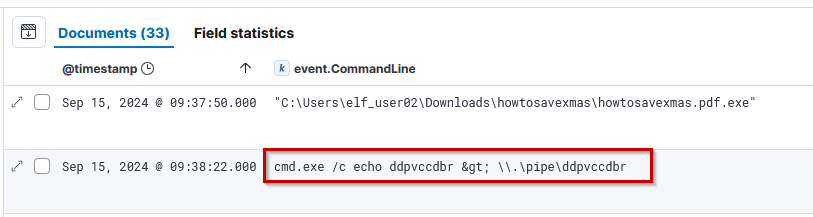
The very next event after the execution of the malicious file was the pipe creation. The pipe is "ddpvccdbr". Submit this to continue.
Question 10: The attacker's process attempted to access a file. Submit the full and complete file path accessed by the attacker's process.
Event ID 4663 is used to detect "An attempt was made to access an object". I added this to my search and filtered by the "howtosavexmas.pdf.exe" process name.
event_source : "WindowsEvent" and hostname : "SleighRider.northpole.local" and event.EventID: 4663 and event.ProcessName: "C:\\Users\\elf_user02\\Downloads\\howtosavexmas\\howtosavexmas.pdf.exe"C:\Users\elf_user02\Desktop\kkringl315@10.12.25.24.pemSubmit the above full path to continue.
Question 11: The attacker attempted to use a secure protocol to connect to a remote system. What is the hostname of the target server?
I knew from the email logs that the attacker's remote IP address is 34.30.110.62. I wasn't sure how to look throught AuthLogs for this in the messages section so I created a wildcard search for the IP address in the Elastic Dev Tools Console.
GET _search?size=1000
{
  "query": {
    "wildcard": {
      "event.message": {
        "value": "*34.30.110.62*"
      }
    }
  }
}"event": {
"hostname": "kringleSSleigH",
"OpcodeDisplayNameText": "Unknown",
"service": "sshd[6125]:",
"message": "Accepted publickey for kkringl315 from 34.30.110.62 port 41606 ssh2: RSA SHA256:AbfXsQOO05qHNT98Rhe1B7KzURo0viFfq2/gpAWlP7E",
"timestamp": "2024-09-15T13:55:22.829978-04:00"
}The attacker logged into host "kringleSSleigH" via SSH to host as user kkringl315. Submit kringleSSleigH to continue.
Question 12: The attacker created an account to establish their persistence on the Linux host. What is the name of the new account created by the attacker?
I added a filter for event.timestamp > "2024-09-15T13:55:22.829978-04:00". This showed me the series of events in the AuthLog that happened directly after the attacker SSH'd into the server. There is a story going on here.
event_source : "AuthLog" and hostname: "kringleSSleigH"Accepted publickey for kkringl315 from 34.30.110.62 port 41606 ssh2: RSA SHA256:AbfXsQOO05qHNT98Rhe1B7KzURo0viFfq2/gpAWlP7E
pam_unix(sshd:session): session opened for user kkringl315(uid=1000) by (uid=0)
New session 58 of user kkringl315.
Starting session: shell on pts/5 for kkringl315 from 34.30.110.62 port 41606 id 0
pam_unix(sudo:auth): authentication failure; logname=kkringl315 uid=1000 euid=0 tty=/dev/pts/5 ruser=kkringl315 rhost= user=kkringl315
kkringl315 : 3 incorrect password attempts ; TTY=pts/5 ; PWD=/opt ; USER=root ; COMMAND=/usr/bin/su
pam_unix(sudo:auth): auth could not identify password for [kkringl315]
kkringl315 : TTY=pts/5 ; PWD=/opt ; USER=root ; COMMAND=/usr/bin/su
pam_unix(sudo:session): session opened for user root(uid=0) by kkringl315(uid=1000)
pam_unix(sudo:session): session opened for user root(uid=0) by kkringl315(uid=1000)
kringl315 : TTY=pts/5 ; PWD=/opt ; USER=root ; COMMAND=/usr/sbin/adduser ssdh
...
kkringl315 : TTY=pts/5 ; PWD=/opt ; USER=root ; COMMAND=/usr/sbin/usermod -a -G sudo ssdh
Reading the events from top to bottom, it looks like the attacker logged in via SSH and then attempted to "sudo su" to root. The first attempt looked like it failed but he eventually succeeded. Then he created a user "ssdh". Submit "ssdh" to continune.
Question 13: The attacker wanted to maintain persistence on the Linux host they gained access to and executed multiple binaries to achieve their goal. What was the full CLI syntax of the binary the attacker executed after they created the new user account?
In the AuthLog message query above there is a line item where the attacker adds the new "ssdh" user to the sudo group with the command "/usr/sbin/usermod -a -G sudo ssdh". Enter this in the terminal to continue.
Question 14: The attacker enumerated Active Directory using a well known tool to map our Active Directory domain over LDAP. Submit the full ISO8601 compliant timestamp when the first request of the data collection attack sequence was initially recorded against the domain controller.
I looked for LDAP bind events, which could indicate LDAP enumeration. There were 1200 events returned.
event_source : "WindowsEvent" and event.EventID: 2889 and hostname : "dc01.northpole.local"I sorted the 1200 events oldest to newest so the start of the attack would be at the top. I got the correctly formatted timestamp from the event.Date field "2024-09-16T11:10:12-04:00" which is slightly different than the "@timestamp" field. Submit "2024-09-16T11:10:12-04:00" to continue.
Question 15: The attacker attempted to perform an ADCS ESC1 attack, but certificate services denied their certificate request. Submit the name of the software responsible for preventing this initial attack.
To find this event, use Sysmon EventID 4888 (Certificate Services denied a certificate request). This indicates a user is requesting a new certificate but got denied for some reason.
event_source : "WindowsEvent" and event.EventID : 4888"event.ReasonForRejection": [
"KringleGuard EDR flagged the certificate request."
]KringleGuard is the name of the service that flagged the request. Submit KringleGuard to continue.
Question 16: We think the attacker successfully performed an ADCS ESC1 attack. Can you find the name of the user they successfully requested a certificate on behalf of?
To look for a certificate request event, look for event ID 4886.
event_source : "WindowsEvent" and event.EventID : 4886"event.UserInformation_UPN": [
"nutcrakr@northpole.local"
]The user was "nutcrakr". Submit this to continue.
Question 17: One of our file shares was accessed by the attacker using the elevated user account (from the ADCS attack). Submit the folder name of the share they accessed.
The EventID 5140 is for when a network share object was accessed. Look for this in the WindowEvents along with the username "nutcrakr".
event_source : "WindowsEvent" and event.EventID: 5140 and event.SubjectUserName : "nutcrakr""event.ShareLocalPath": [
"\\??\\C:\\WishLists"
]The folder name that was accessed was "WishLists". Submit this to continue.
Question 18: The naughty attacker continued to use their privileged account to execute a PowerShell script to gain domain administrative privileges. What is the password for the account the attacker used in their attack payload?
I found this one by looking at Powershell script blocks recorded by event 4104. I skimmed through some of the responses until I saw one that looked suspicious.
event_source : "WindowsEvent" and event.EventID: 4104Add-Type -AssemblyName System.DirectoryServices $ldapConnString = "LDAP://CN=Domain Admins,CN=Users,DC=northpole,DC=local" $username = "nutcrakr" $pswd = 'fR0s3nF1@k3_s' $nullGUID = [guid]'00000000-0000-0000-0000-000000000000' $propGUID = [guid]'00000000-0000-0000-0000-000000000000' $IdentityReference = (New-Object System.Security.Principal.NTAccount("northpole.local\$username")).Translate([System.Security.Principal.SecurityIdentifier]) $inheritanceType = [System.DirectoryServices.ActiveDirectorySecurityInheritance]::None $ACE = New-Object System.DirectoryServices.ActiveDirectoryAccessRule $IdentityReference, ([System.DirectoryServices.ActiveDirectoryRights] "GenericAll"), ([System.Security.AccessControl.AccessControlType] "Allow"), $propGUID, $inheritanceType, $nullGUID $domainDirEntry = New-Object System.DirectoryServices.DirectoryEntry $ldapConnString, $username, $pswd $secOptions = $domainDirEntry.get_Options() $secOptions.SecurityMasks = [System.DirectoryServices.SecurityMasks]::Dacl $domainDirEntry.RefreshCache() $domainDirEntry.get_ObjectSecurity().AddAccessRule($ACE) $domainDirEntry.CommitChanges() $domainDirEntry.dispose() $ldapConnString = "LDAP://CN=Domain Admins,CN=Users,DC=northpole,DC=local" $domainDirEntry = New-Object System.DirectoryServices.DirectoryEntry $ldapConnString, $username, $pswd $user = New-Object System.Security.Principal.NTAccount("northpole.local\$username") $sid=$user.Translate([System.Security.Principal.SecurityIdentifier]) $b=New-Object byte[] $sid.BinaryLength $sid.GetBinaryForm($b,0) $hexSID=[BitConverter]::ToString($b).Replace('-','') $domainDirEntry.Add("LDAP://") $domainDirEntry.CommitChanges() $domainDirEntry.dispose() The attacker attempted to add a domain admin with password "fR0s3nF1@k3_s". Submit this to continue.
Question 19: The attacker then used remote desktop to remotely access one of our domain computers. What is the full ISO8601 compliant UTC EventTime when they established this connection?
Look for successful login event ID 4624. Login Type 10 is remote desktop login.
event_source : "WindowsEvent" and event.EventID: 4624 and event.LogonType: 10"event.EventTime": [
"2024-09-16T15:35:57.000Z"
]Submit the event time of the RDP login "2024-09-16T15:35:57.000Z" to continue.
Question 20: The attacker is trying to create their own naughty and nice list! What is the full file path they created using their remote desktop connection?
I looked for process creation events (EventID 1) on the domain controller made by the attacker's user "nutcrakr".
event_source : "WindowsEvent" and event.EventID: 1 and hostname: "dc01.northpole.local" and event.User : "NORTHPOLE\\nutcrakr" "C:\Windows\system32\NOTEPAD.EXE" C:\WishLists\santadms_only\its_my_fakelst.txtThe result returned 37 process events. I skimmed the event.CommandLine fields until I saw one regarding a list of some sort. The full path of the list is "C:\WishLists\santadms_only\its_my_fakelst.txt". Submit this to continue.
Question 21: The Wombley faction has user accounts in our environment. How many unique Wombley faction users sent an email message within the domain?
I used the Elastic Dev Tools Console to find this one. I looked for email addresses that matched the pattern "*wcub*" and aggregated the result on the email address.
GET _search
{
  "query": {
    "wildcard": {
      "event.From": {
        "value": "*wcub*"
      }
    }
  },
  "aggs":{
      "unique_names": {
          "terms": {
              "field": "event.From",
              "size": 10000
          }
      }
  },
  "_source": false
}"aggregations": {
"unique_names": {
"doc_count_error_upper_bound": 0,
"sum_other_doc_count": 0,
"buckets": [
{
"key": "wcube311@northpole.local",
"doc_count": 35
},
{
"key": "wcub808@northpole.local",
"doc_count": 33
},
{
"key": "wcub303@northpole.local",
"doc_count": 32
},
{
"key": "wcub101@northpole.local",
"doc_count": 23
}
]
}
}There are 4 email addresses that look like Wombley's team. Enter 4 to continue.
Question 22: The Alabaster faction also has some user accounts in our environment. How many emails were sent by the Alabaster users to the Wombley faction users?
I used a double wildcard search approach to filter the To and From fields to what I wanted.
GET _search?size=1000
{
  "query": {
    "bool": {
      "must": [
        {
          "wildcard": {
            "event.From": {
              "value": "*asnowball*"
            }
          }
        },
        {
          "wildcard": {
            "event.To": {
              "value": "wcub*"
            }
          }
        }
      ]
    }
  }
}"hits": {
"total": {
"value": 22,
"relation": "eq"
}
}There were 22 emails that fit the criteria. Enter 22 in the terminal to continue.
Question 23: Of all the reindeer, there are only nine. What's the full domain for the one whose nose does glow and shine? To help you narrow your search, search the events in the 'SnowGlowMailPxy' event source.
To do this one I used the Elastic Dev Tools Console to pull all the "From" emails from the event logs. I then used a short python script to collect, dedupe, and print the domains. I can then inspect them for the one related to Rudolph.
GET _search?size=1000
{
  "aggs":{
      "unique_names": {
          "terms": {
              "field": "event.To",
              "size": 10000
          }
      }
  },
  "_source": false
}
The result was many, many email addresses. I saved them to a file called emails.json. The below python script parses emails.json.
import json

with open("emails.json") as f:
    obj = json.load(f)

domains = []
for bucket in obj["aggregations"]["unique_names"]["buckets"]:
    domains.append(bucket["key"].split("@")[1])

domains = list(set(domains))

for domain in domains:
print(domain)evergreen.tree
wicked.snow
pr4nc3r.trot
santa.hut
sleigh.ride
northstar.nibbles
stocking.chimney
icicle.light
twinkle.light
tinsel.town
northpole.local
merry.elves
twilight.star
nogfest.eggnog
wreath.maker
ginger.snap
starlight.tree
rud01ph.glow
nutcracker.tale
yule.log
snowflakekingdom.chill
jolly.jingle
c0m3t.halleys
elf.toyshop
cheery.fireplace
bells.ring
frosty.north
mistlebranch.vixen
snowflake.spark
blizzard.north
gingerbread.house
candycane.factory
reindeers.fly
tinsel.wrap
pine.tree
snowdrift.globe
toytinkers.land
gingerlane.dancer
holly.jolly
reindeer.corral
snowy.landThis is a more manageable list to read. There it is... rud01ph.glow. Enter "rud01ph.glow" in the terminal to move on the last question.
Question 24: With a fiery tail seen once in great years, what's the domain for the reindeer who flies without fears? To help you narrow your search, search the events in the 'SnowGlowMailPxy' event source.
I can use the same domain list from question 23. The fiery tail comment makes me look for a domain related to Comet. There it is... c0m3t.halleys. Enter "c0m3t.halleys" in the terminal to get the Gold trophy!
| Santa Vision | Where to next? | Decrypt the Naughty-... |
Holiday Hack Challenge 2024 Report - Cody Travis <cody@chillaspect.com>